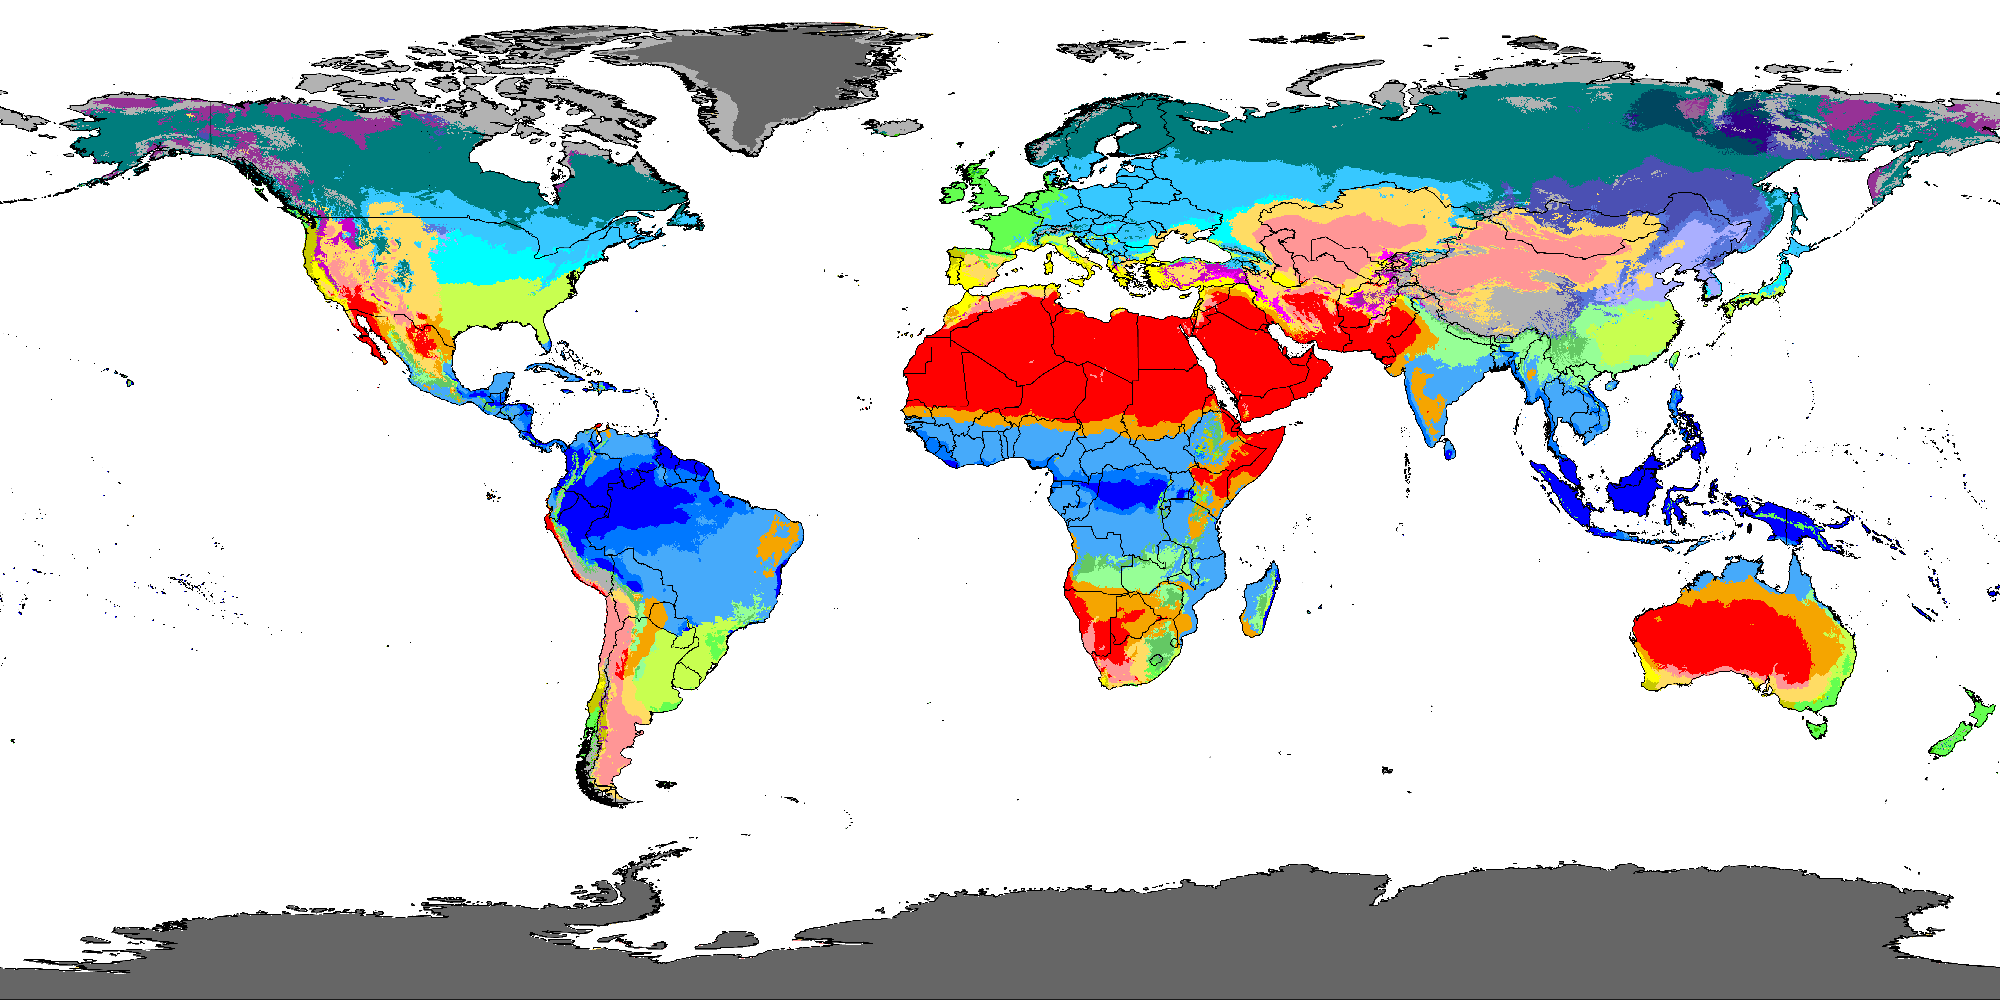
How was this map made?
The climate colors come from the official map image published in Beck, H.E., Zimmermann, N. E., McVicar, T. R., Vergopolan, N., Berg, A., & Wood, E. F., "Present and future Köppen-Geiger climate classification maps at 1-km resolution" (Scientific Data, 2018, CC BY 4.0 license), resized and adapted for the web. Country borders use public-domain data fromNatural Earth.
Each climate code's exact position was verified by directly sampling the pixel colors of the original map image at around 55 well-known reference locations around the world (the Amazon, the Sahara, Paris, Antarctica, and more). Five rare boundary subtypes that appear only in very small, localized areas such as high mountain ranges — Csc, Cwc, Dsc, Dsd, and Dwd — were hard to pin to a specific reference point, so they're excluded from the legend; clicking those areas shows the closest neighboring climate as an approximation.
What is the Köppen climate classification?
Devised by Austrian climatologist Wladimir Köppen, this is the world's most widely used climate classification system. It divides the Earth's climates into five major groups (A-E) and their subtypes, based on temperature and precipitation patterns.
Frequently Asked Questions
Are the boundaries on the map always exact?
Climate boundaries actually shift gradually in the real world, and academic sources vary slightly depending on the data and methods used. This map is based on the widely cited Beck et al. (2018) dataset.
Why are there black lines or gray areas on the map?
The black lines are country borders. Some areas may show no data where weather observation records are too sparse to classify.
Does the climate classification always match actual vegetation?
The Köppen classification was originally designed around vegetation distribution, so it lines up quite well with actual vegetation zones — but there are exceptions due to human development or unusual terrain.